Indoor location
This project aims to assess the effectiveness of Machine Learning prediction algorithms—such as Decision Tree, K-Nearest Neighbors, Support Vector Classifier—in determining device locations based on WiFi signal strengths indoors. It utilizes datasets from Eldorado and Jaume I University. Indoors, GPS signals frequently falter due to obstructions like buildings, which hinder reception, as well as materials such as concrete and metal that diminish signals, and multipath interference that distorts signals. Hence, alternative localization methods are imperative for precise indoor positioning.

Context
In today's increasingly interconnected world, indoor positioning systems have emerged as crucial tools for a wide array of applications, ranging from enhancing user experience in shopping malls to optimizing workflow in industrial settings. One promising approach utilizes WiFi signals to determine the location of individuals within buildings. Unlike GPS, which struggles with accuracy indoors due to signal interference, WiFi-based positioning offers a viable solution. This project seeks to harness the power of classification machine learning algorithms to precisely locate users within indoor environments based on WiFi signal strength measurements.
Objective
The primary goal of this project is to evaluate and compare the performance of various classification machine learning algorithms in accurately determining the location of users within buildings using WiFi signal strength data. The algorithms under consideration include Decision Tree, Random Forest, Extra-Trees, Gaussian Naive Bayes, K-Nearest Neighbors, Logistic Regression, Support Vector Classification, and Extreme Gradient Boosting.
About the datasets
This project utilizes two datasets: one from Jaume I University (UJIIndoorLoc) and another from Eldorado mall in São Paulo, which is not publicly available. Both datasets include WiFi signal strength measurements (RSSI) and corresponding room classifications. The Jaume I dataset provides additional information such as floor, building, coordinates, and user details, though only RSSI and room data are relevant for this project. The aim is to compare classification machine learning algorithms' performance in indoor positioning using WiFi signal strength, crucial for accurate indoor navigation where GPS signals are unreliable.
Acknowledgements
This project, conducted as part of a scientific initiation program at the University of São Paulo, expands upon the groundwork laid by the Net.Map, which initially applied machine learning algorithms for indoor user localization. However, the focus of this study extends beyond simple localization; it aims to compare the performance metrics of a diverse array of machine learning algorithms, including newer methodologies not previously explored. This broadened scope allows for a comprehensive evaluation and selection of the most effective algorithms for indoor positioning systems, thus advancing the field's understanding and applicability.
Acknowledgments are extended to Bradesco Bank for their support throughout this research endeavor. Additionally, the paper titled "Data Cleansing for Indoor Positioning Wi-Fi Fingerprinting Datasets" played a pivotal role in establishing the data cleansing procedures. By incorporating this innovative technique, the reliability and accuracy of the datasets were ensured, thereby enhancing the robustness of the analysis. Leveraging datasets from both academic and commercial environments, originally utilized in the Net.Map project, enables a thorough assessment of machine learning algorithms' efficacy in indoor positioning applications, contributing to the development of more accurate and reliable location-based services.
Used technologies
In the analysis and prediction of location within the used datasets, Jupyter notebooks and essential Python libraries such as pandas, matplotlib, seaborn, and scikit-learn were employed.
Exploratory Data Analysis (EDA)
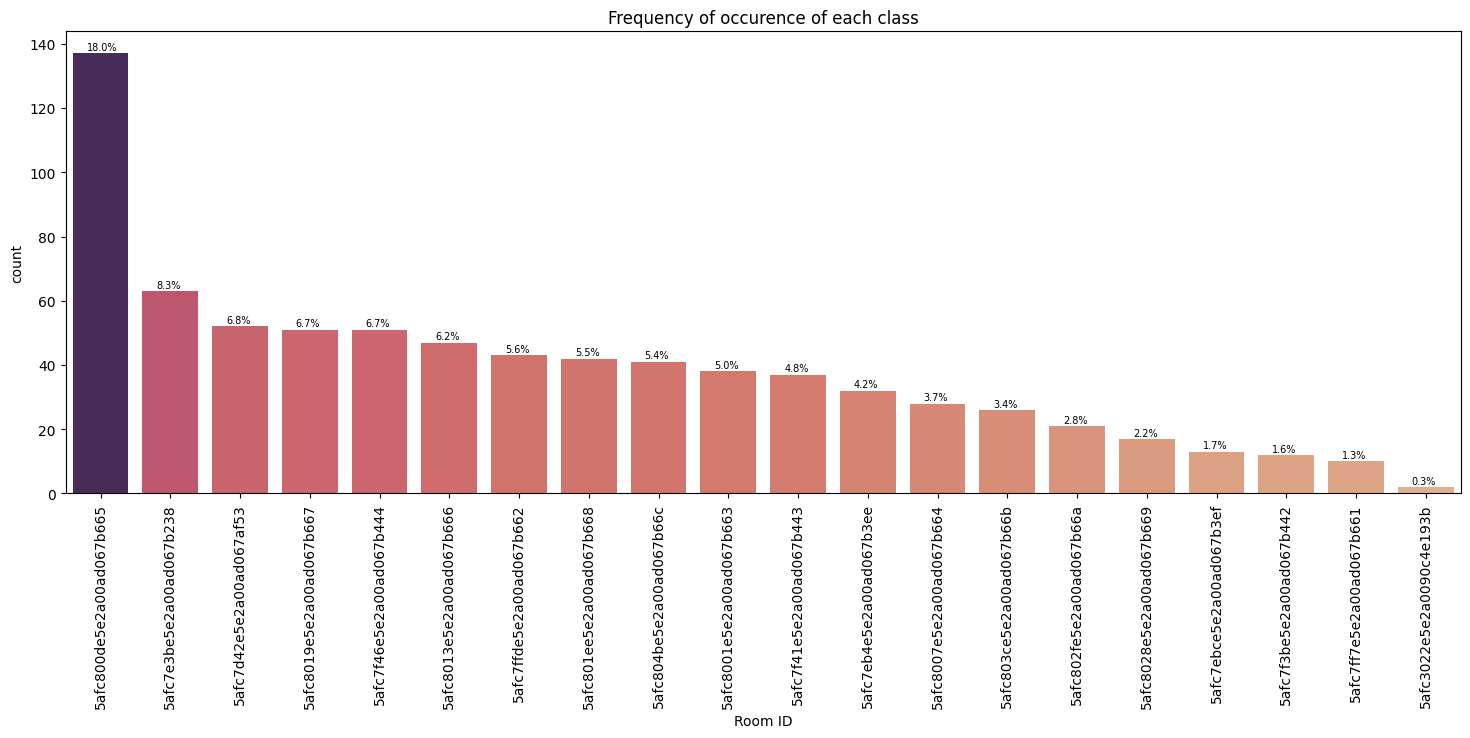
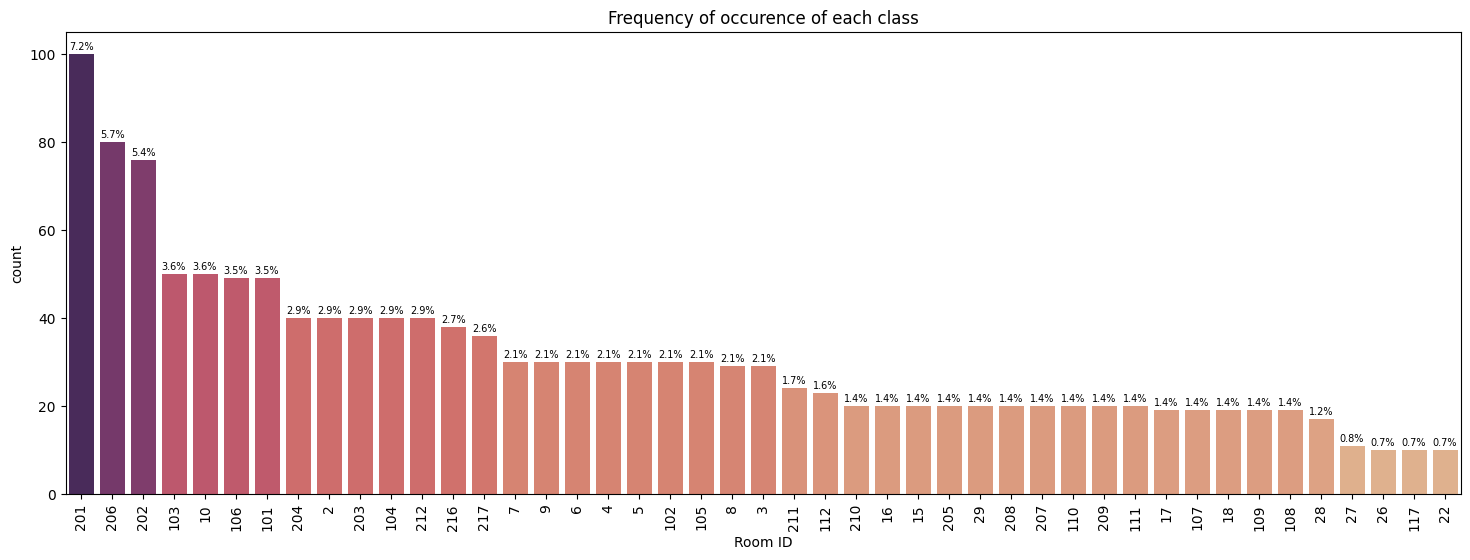
The Eldorado mall dataset consists of 763 rows and 581 columns, while the UJIIndoorloc dataset comprises 1396 rows and 521 columns. Both datasets underwent preprocessing to remove irrelevant columns, retaining only RSSI measurements from various WiFi networks. The final column in each dataset serves as room labels, indicating the user's location during signal capture. While the Eldorado mall dataset has 20 room labels, the UJIIndoorloc dataset contains 45 room labels, reflecting nuanced labeling structures.
Frequency of occurence of each label
In this section, both charts depict the frequency distribution of each class or room label within their respective datasets, revealing significant class imbalance. This imbalance highlights the necessity for cautious model training to mitigate biases and ensure optimal performance. The visual representation of class frequencies serves as crucial context for understanding dataset characteristics and guiding strategies to address class imbalance during model development.
Data cleaning and pre-processing
Data cleaning and pre-processing are crucial steps in preparing datasets for machine learning tasks, ensuring data quality and relevance. For both the Eldorado mall and UJIIndoorloc datasets, a multi-faceted approach was employed to enhance data integrity and reduce dimensionality. Firstly, low variance filtering was applied to identify columns with minimal variance, indicative of limited variability across the dataset. By removing columns where the variance was zero, this technique effectively reduced dimensionality, focusing on features with meaningful variability that contribute to classification tasks.
Subsequently, the feature importance functionality of the random forest classifier was utilized to assess the relevance of each feature in predicting the target variable. Through training the random forest model on the dataset, the importance of each feature was evaluated based on its impact on model performance. Features with zero importance, suggesting negligible predictive power, were pruned from the dataset, further refining the feature set. Additionally, a data cleaning strategy informed by the paper "Data Cleansing for Indoor Positioning Wi-Fi Fingerprinting Datasets" was adopted, drawing on established techniques to enhance the quality and reliability of indoor positioning datasets. Furthermore, as part of pre-processing, the dataset columns were normalized to have a zero mean and standard deviation of 1, ensuring uniform scaling and facilitating convergence during model training.
Choosing algorithms
In this section, an overview is provided of the machine learning algorithms employed for indoor location classification based on WiFi signal strengths. Accurate indoor localization is vital for numerous applications, and the variability of WiFi signals within buildings necessitates robust classification approaches. A range of algorithms is examined, including Decision Tree, Random Forest, Extra-Trees, Gaussian Naive Bayes, K-Nearest Neighbors, Logistic Regression, Support Vector Classification, and Extreme Gradient Boosting. Each algorithm offers unique strengths such as interpretability, computational efficiency, and handling of complex relationships and large datasets.
- Decision Tree: Interpretable results suitable for room-based classification, may overfit on large datasets; fast training but may increase significantly with hyperparameter optimization, impacting computational time.
- Random Forest: Robust against overfitting, efficient on big datasets with parallel processing; hyperparameter optimization can increase training time, but benefits from ensemble learning for improved performance.
- Extra-Trees: Faster training than Random Forest due to randomized thresholds, suitable for large datasets; can have higher computational time during hyperparameter optimization compared to other algorithms due to its randomized split points, which lead to a larger search space. This results in longer training times as each combination of hyperparameters requires building multiple trees.
- Gaussian Naive Bayes: Fast training even with large datasets, suitable for smaller datasets, may lack complexity for very large ones ; hyperparameter optimization is minimal due to simplicity, maintaining low computational time.
- K-Nearest Neighbors: Effective with high-dimensional data, slower on large datasets due to distance computations; hyperparameter optimization increases training time, especially with larger datasets, impacting computational efficiency.
- Logistic Regression: Efficient for room classification tasks, scales well with dataset size; hyperparameter optimization adds minimal overhead, maintaining fast training times.
- Support Vector Classification: Effective for high-dimensional data, may be slower for very large datasets due to kernel complexity; hyperparameter optimization can significantly increase training time, especially with non-linear kernels.
- Extreme Gradient Boosting (XGBoost): High performance on room-based classification, longer training times compared to simpler algorithms; hyperparameter optimization can substantially increase training time due to the complexity of the model and the search space, impacting computational efficiency.
Algorithms' implementation
The implementation of classification machine learning algorithms followed a structured approach to ensure reliable model training and evaluation. Initially, the datasets were split into training and testing sets using an 80%-20% ratio, enabling independent validation of model performance. Default configurations were employed as the base case for training each algorithm, after which hyperparameter optimization was conducted using both random search and grid search techniques. Hyperparameter spaces were defined for each algorithm, allowing for systematic exploration of various configurations. The best-performing parameters, identified through cross-validation on the training set, were selected to train the final models. This iterative process aimed to maximize classification accuracy and generalization performance.
Performance comparison
The performance of multiclass classification algorithms for indoor location classification was rigorously assessed using a diverse set of evaluation metrics. These metrics included accuracy, precision macro-averaged, F1-score macro-averaged, recall macro-averaged, Matthew's correlation coefficient, Cohen's kappa score, log loss (cross-entropy), and computational time. Comparisons were conducted between different algorithms and also between using or not using hyperparameter optimization techniques, aiming to identify the most effective algorithms and optimization strategies for indoor location classification tasks.
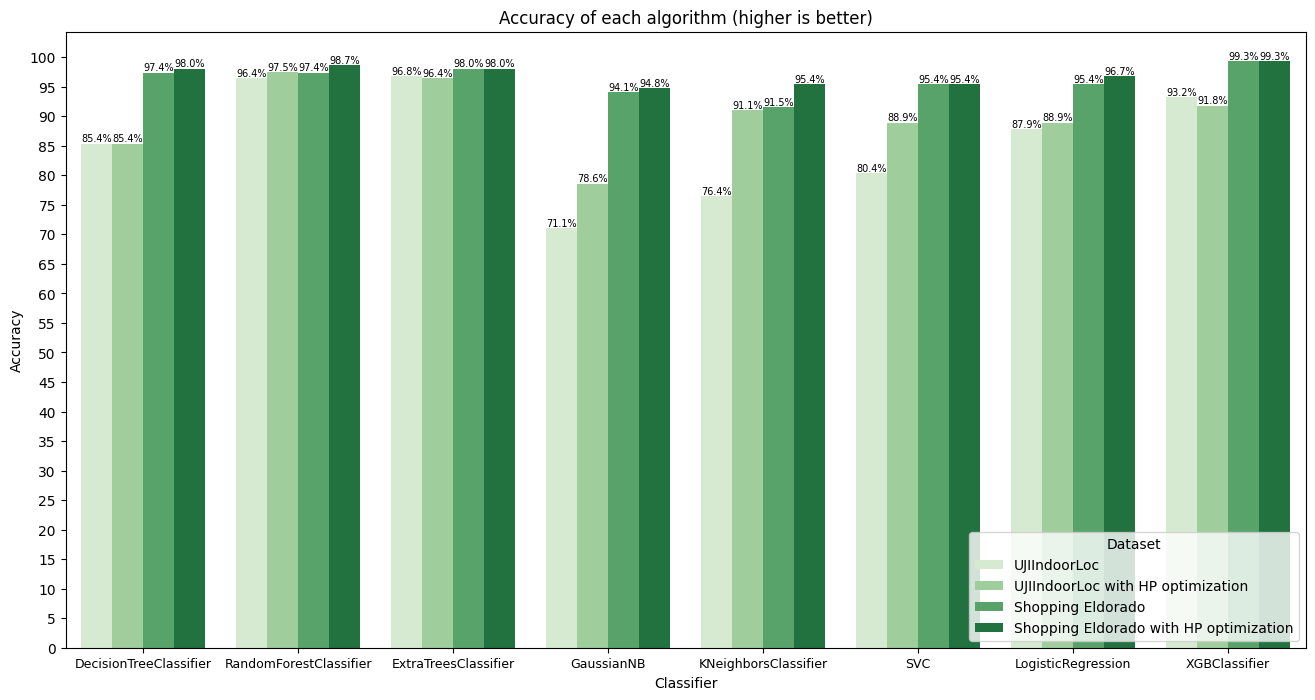
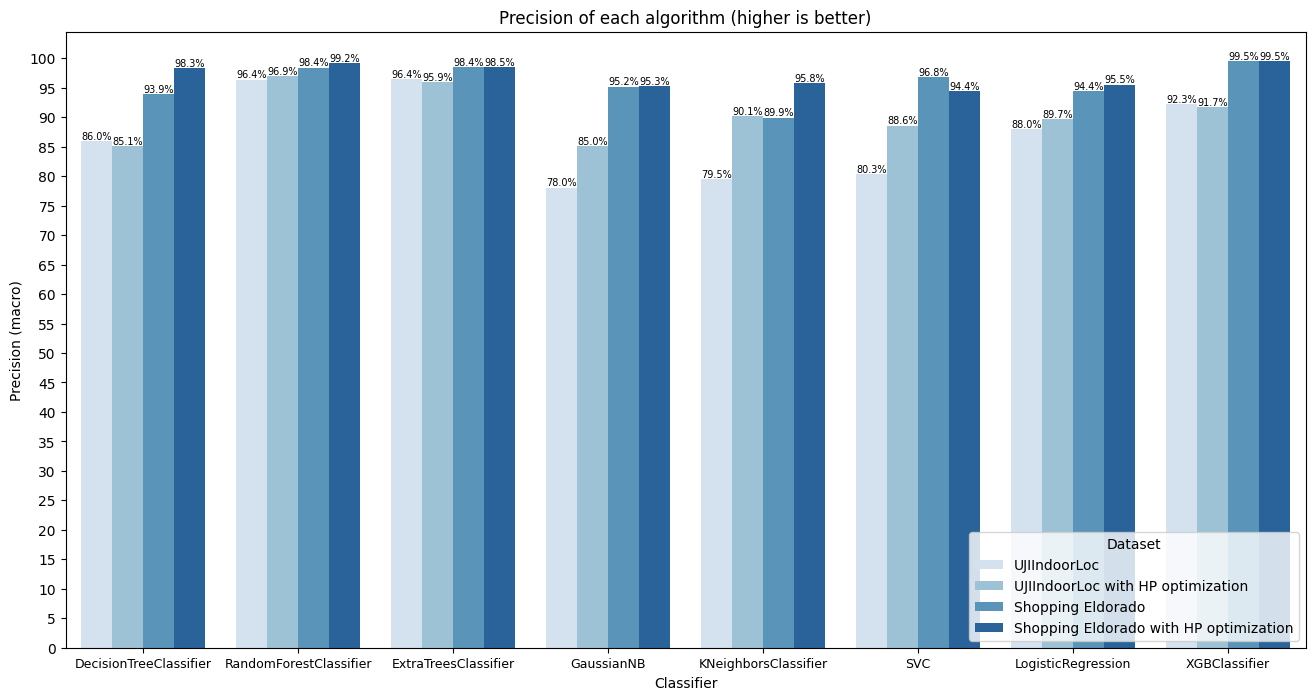
Accuracy and precision
The classification algorithms' performance varied in terms of accuracy and precision across the two datasets. Figures 3 and 4 show the results for both metrics. Decision tree achieved high accuracy on the simpler Shopping Eldorado dataset, with both standard and optimized versions performing well. However, its precision varied slightly between datasets, indicating some variability in correctly identifying positive instances. Extra-trees demonstrated consistently high accuracy and precision on both datasets, highlighting its robustness and ability to generalize well to different scenarios. Gaussian Naive Bayes, while showing decent accuracy on the simpler dataset, struggled with precision on the UJIIndoorLoc dataset, possibly due to its assumption of feature independence. KNN exhibited moderate accuracy and precision, with a slight improvement seen with hyperparameter optimization. Logistic regression displayed good accuracy but relatively lower precision, especially on the UJIIndoorLoc dataset, suggesting some misclassifications of positive instances. Random forest consistently showed high accuracy and precision, indicating its effectiveness in capturing complex patterns and generalizing well to new data. SVC showed moderate accuracy and precision, with slight improvements observed with hyperparameter optimization, particularly on the UJIIndoorLoc dataset. XGBoost achieved the highest accuracy and precision on both datasets, highlighting its effectiveness in capturing intricate patterns and accurately identifying positive instances.
Overall, extra-trees, random forest, and XGBoost emerged as the top-performing algorithms, demonstrating high accuracy and precision across both datasets. Their ensemble and gradient boosting techniques likely contributed to their superior performance by effectively capturing complex relationships in the data and making accurate predictions.
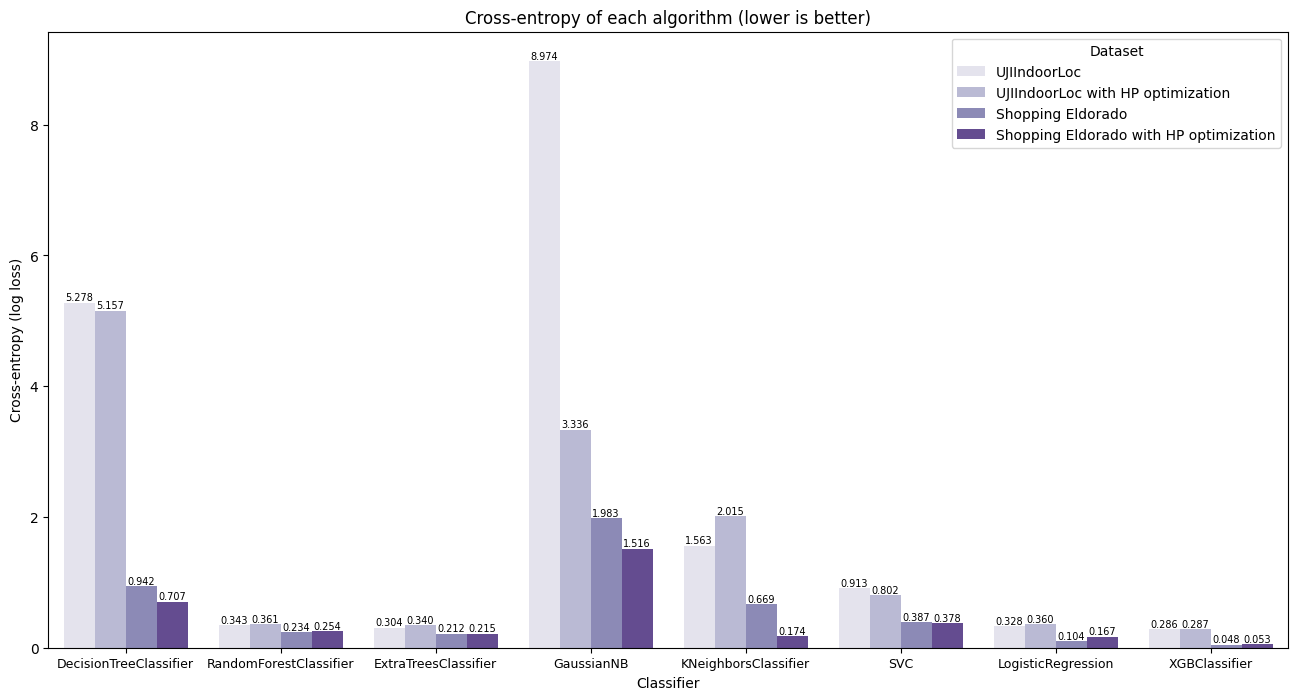
Cross-entropy (log-loss)
The log-loss metric measures the accuracy of a classifier's predicted probabilities compared to the actual labels. This performance metric is displayed on Figure 5 for all datasets and algorithms in analysis. Lower log-loss values indicate better performance. In the given results, decision tree and gaussian naive bayes consistently exhibit higher log-loss values across both datasets. Decision trees, including decision tree and extra-trees classifiers, tend to overfit the training data, resulting in poor generalization to unseen data, which is reflected in their higher log-loss values. Gaussian naive bayes, being a naive Bayes classifier, assumes independence among features, which might not hold true for complex datasets like indoor location data, leading to suboptimal probability estimation and higher log-loss values.
KNN also demonstrates relatively higher log-loss values, especially on the UJIIndoorLoc dataset. This could be because the algorithm's performance heavily depends on the choice of the k parameter and may struggle to capture the underlying patterns in high-dimensional datasets like indoor location data. However, with hyperparameter optimization, some improvements in performance are observed, indicating better model calibration.
On the other hand, algorithms like logistic, random forest, SVC, and XGBoost consistently demonstrate lower log-loss values across both datasets. These algorithms are known for their robustness and effectiveness in probability estimation tasks. They generally avoid overfitting and have mechanisms to handle complex decision boundaries, resulting in better generalization. Among them, XGBoost stands out as the best-performing algorithm, followed closely by logistic regression and random forest. XGBoost's gradient boosting framework and ensemble techniques enable it to capture complex relationships in the data, leading to superior performance in probability estimation tasks.
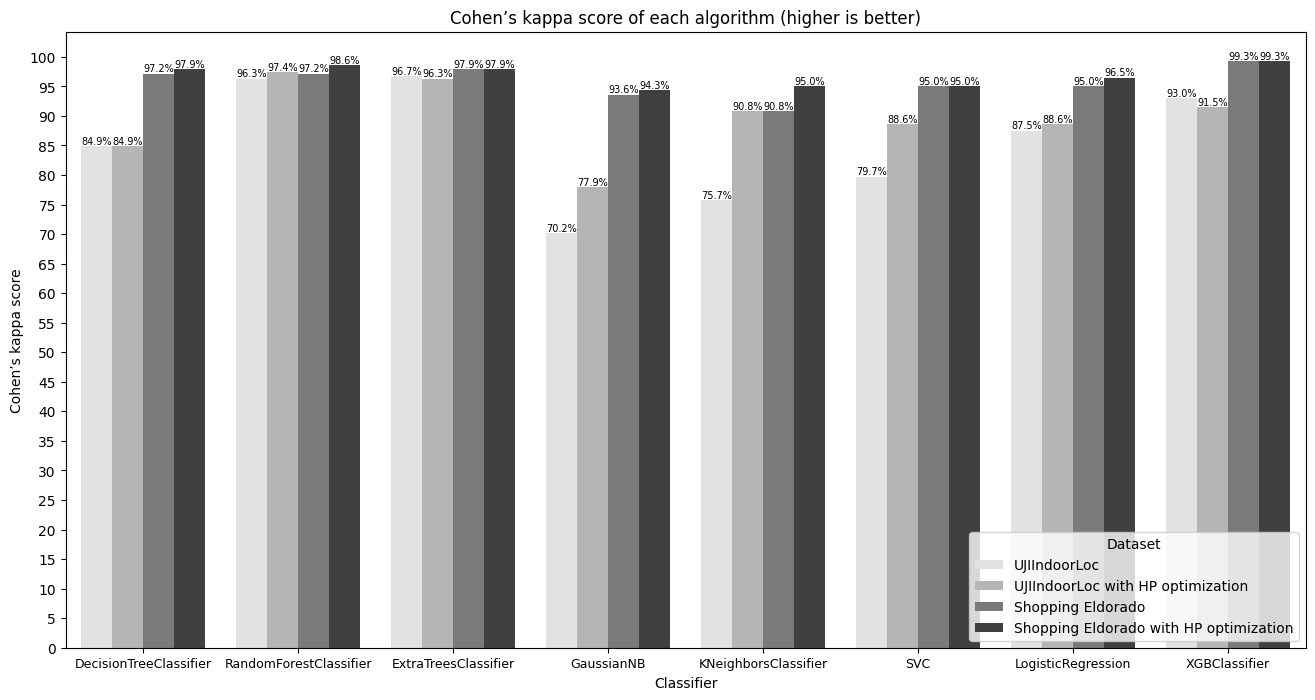
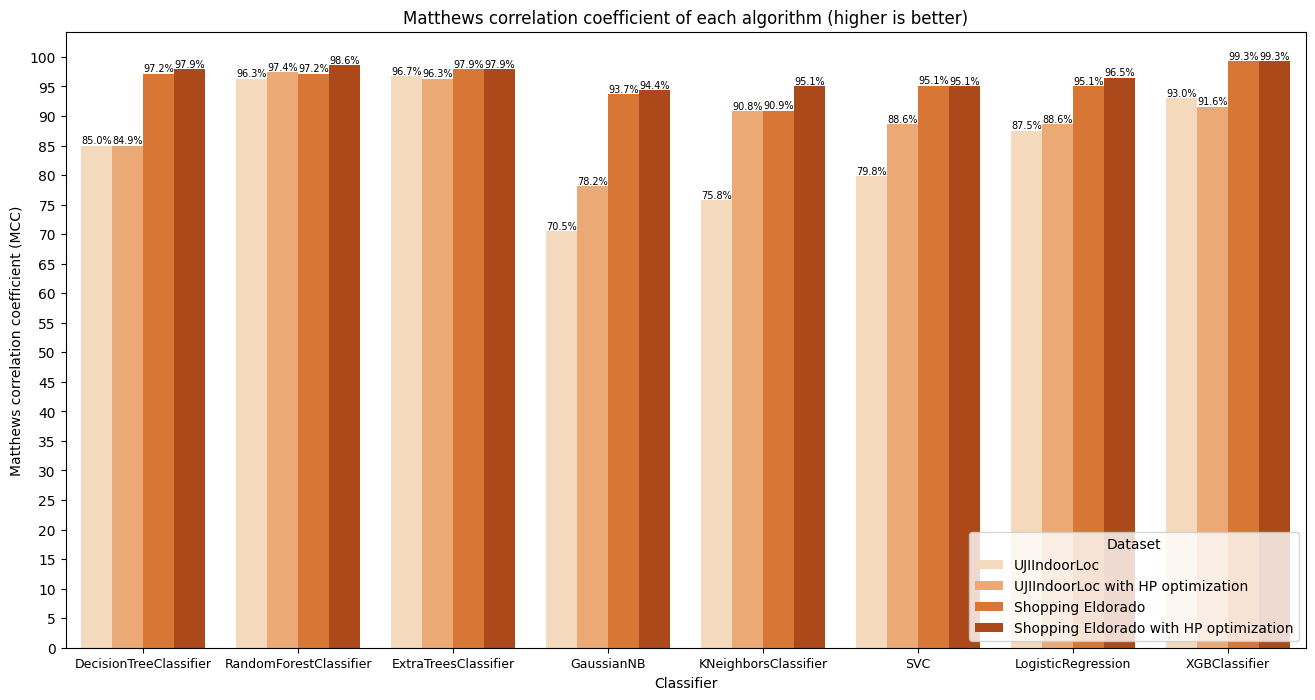
Cohen Kappa's Score and Matthew's Correlation Coefficient
Cohen's kappa score and Matthew's correlation coefficient are commonly used metrics for evaluating the performance of classification algorithms, especially in multiclass classification tasks. These metrics are preferred because they consider both correct and incorrect predictions and account for chance agreement, making them suitable for imbalanced datasets or datasets with multiple classes. Figures 6 and 7 show these metrics results for the selected algorithms and datasets.
Looking at the results, decision tree, extra-trees, random forest, logistic regression, SVC, and XGBoost consistently demonstrate high Cohen's kappa scores and Matthew's correlation coefficients across both datasets. These algorithms exhibit strong performance in capturing the underlying patterns and relationships within the data, resulting in high agreement between predicted and actual classifications.
Gaussian naive Bayes and KNN show moderate agreement scores, especially on the UJIIndoorLoc dataset. Gaussian naive Bayes assumes independence among features, which might not hold true for complex datasets like indoor location data with correlated features. KNN's performance may be sensitive to the choice of the k parameter and the dataset's dimensionality, affecting its agreement scores.
Among the best-performing algorithms, XGBoost stands out with near-perfect agreement scores, indicating its superior performance in indoor location classification tasks. XGBoost, along with other top-performing algorithms, leverages its strengths in capturing complex patterns and relationships within the data to achieve high agreement between predicted and actual classifications. On the other hand, Gaussian naive bayes and KNN, although showing moderate performance, exhibit comparatively lower agreement scores due to their limitations in handling complex data patterns.
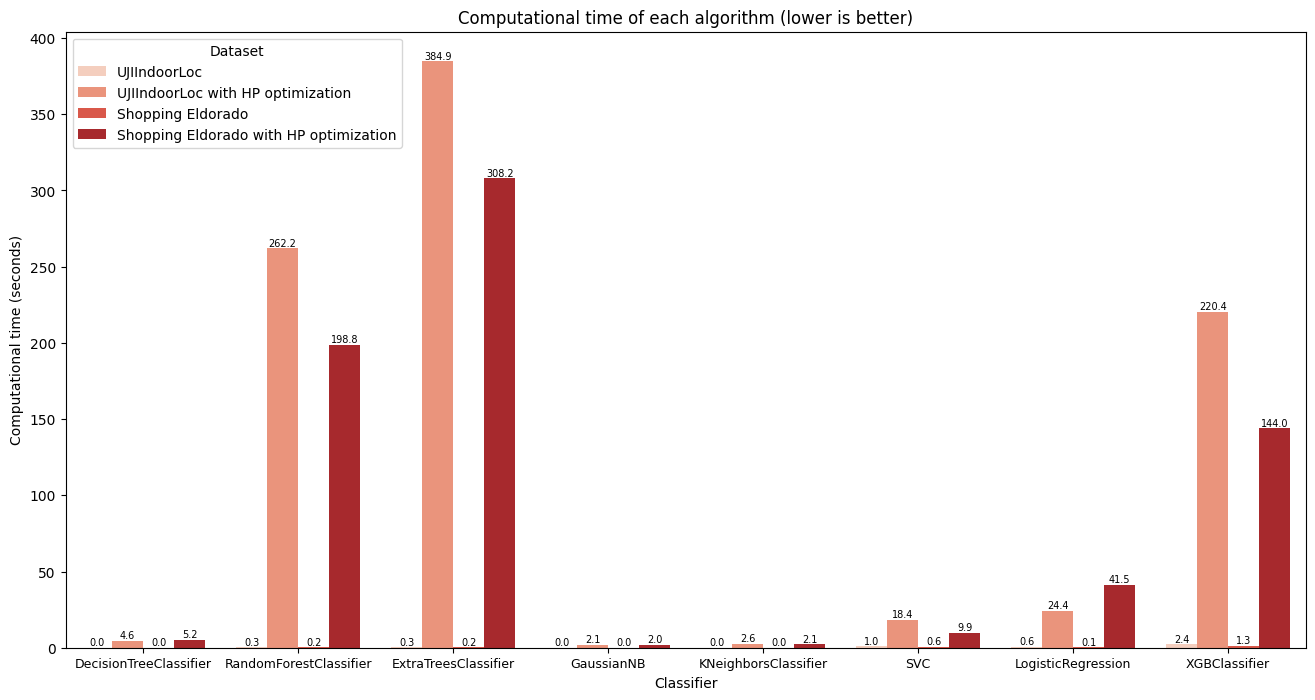
Computational time
In terms of computational time performance, from worst to best, the algorithms exhibit varying efficiency. Figure 8 shows the results for computational time for each of the analyzed algorithms and datasets. At the lower end of the spectrum, algorithms like extra-trees with hyperparameter optimization and random forest with hyperparameter optimization demand the most time, clocking in at 384.87 and 262.20 seconds, respectively, on the UJIIndoorLoc dataset. These ensemble methods undergo exhaustive search processes during hyperparameter optimization, significantly increasing computational overhead. This extensive tuning, while potentially enhancing model performance, comes at the cost of longer computation times, impacting real-time deployment feasibility.
Following closely, XGBoost with hyperparameter optimization takes 220.41 seconds, as its gradient boosting framework requires iterative optimization, prolonging computational time. However, despite its relatively longer computational time, XGBoost achieves high performance metrics, indicating a trade-off between computational efficiency and model effectiveness. Meanwhile, algorithms like SVC with hyperparameter optimization and logistic regression with hyperparameter optimization demonstrate respectable performances, consuming 18.37 and 24.38 seconds, respectively, on the UJIIndoorLoc dataset. The complexity of solving quadratic programming problems contributes to the SVC's longer optimization duration, while logistic regression's simpler model architecture leads to relatively shorter optimization times despite hyperparameter tuning.
At the faster end of the spectrum, algorithms such as extra-trees and random forest without hyperparameter optimization exhibit more efficient computational times, at 0.30 and 0.29 seconds, respectively, on the UJIIndoorLoc dataset. These ensemble methods offer a balance between computational efficiency and model performance without the need for extensive hyperparameter tuning. Gaussian naive Bayes, with its simple probabilistic approach, demonstrates the best computational time performance, requiring only 0.01 seconds. Its efficiency stems from the assumption of feature independence and straightforward parameter estimation, making it highly suitable for applications where computational resources are limited. However, it often sacrifices some level of predictive power compared to more complex algorithms. Therefore, while computational time is crucial for real-time applications, it must be balanced with model performance considerations.
Choosing best cases
In comparing the classification algorithms for indoor location, it's evident that Random Forest, Extra Trees, and XGBoost consistently outperform other algorithms across various metrics and datasets. These algorithms exhibit high accuracy, precision, F1 score, recall, Matthews correlation coefficient (MCC), and Cohen’s kappa score, as shown on Table 1. They are particularly well-suited for multiclass classification tasks due to their ability to handle complex datasets with multiple classes efficiently.
One significant factor contributing to the success of these algorithms is their robustness and adaptability to different datasets and problem domains. Random Forest, Extra Trees, and XGBoost are ensemble learning methods that combine multiple weak learners to create a strong classifier, enabling them to capture complex relationships in the data and avoid overfitting. Additionally, these algorithms offer scalability and computational efficiency, making them suitable for large-scale datasets like UJIIndoorLoc and Shopping Eldorado.
While hyperparameter optimization can improve the performance of classifiers, it comes with drawbacks such as increased computational time and the risk of overfitting to the training data. The computational time for algorithms like Random Forest and XGBoost significantly increases with hyperparameter optimization, which may not be feasible for real-time applications or large datasets. Despite this drawback, Random Forest, Extra Trees, and XGBoost emerge as the top-performing algorithms due to their superior performance across multiple metrics and datasets. Their ability to balance computational efficiency with high predictive accuracy makes them ideal choices for indoor location classification tasks.
| Accuracy | Precision | F1 | Recall | MCC | CK | Log loss | Time | ||
|---|---|---|---|---|---|---|---|---|---|
| Classifier | Dataset | ||||||||
| Decision Tree | Eldorado | 97.4% | 93.9% | 93.3% | 93.0% | 97.2% | 97.2% | 0.94 | 0.02 |
| Eldorado HPO | 98.0% | 98.3% | 98.2% | 98.4% | 97.9% | 97.9% | 0.71 | 5.24 | |
| UJIIndoorLoc | 85.4% | 86.0% | 85.3% | 86.5% | 85.0% | 84.9% | 5.28 | 0.03 | |
| UJIIndoorLoc HPO | 85.4% | 85.1% | 84.4% | 85.4% | 84.9% | 84.9% | 5.16 | 4.64 | |
| Extra-Trees | Eldorado | 98.0% | 98.4% | 98.6% | 99.0% | 97.9% | 97.9% | 0.21 | 0.21 |
| Eldorado HPO | 98.0% | 98.5% | 97.2% | 96.5% | 97.9% | 97.9% | 0.21 | 308.16 | |
| UJIIndoorLoc | 96.8% | 96.4% | 96.1% | 96.6% | 96.7% | 96.7% | 0.30 | 0.30 | |
| UJIIndoorLoc HPO | 96.4% | 95.9% | 95.8% | 96.4% | 96.3% | 96.3% | 0.34 | 384.87 | |
| Gaussian Naive Bayes | Eldorado | 94.1% | 95.2% | 93.6% | 93.0% | 93.7% | 93.6% | 1.98 | 0.01 |
| Eldorado HPO | 94.8% | 95.3% | 94.7% | 95.5% | 94.4% | 94.3% | 1.52 | 2.03 | |
| UJIIndoorLoc | 71.1% | 78.0% | 71.5% | 73.5% | 70.5% | 70.2% | 8.97 | 0.01 | |
| UJIIndoorLoc HPO | 78.6% | 85.0% | 80.7% | 82.5% | 78.2% | 77.9% | 3.34 | 2.08 | |
| KNN | Eldorado | 91.5% | 89.9% | 87.6% | 89.0% | 90.9% | 90.8% | 0.67 | 0.01 |
| Eldorado HPO | 95.4% | 95.8% | 94.1% | 93.7% | 95.1% | 95.0% | 0.17 | 2.15 | |
| UJIIndoorLoc | 76.4% | 79.5% | 74.3% | 74.1% | 75.8% | 75.7% | 1.56 | 0.00 | |
| UJIIndoorLoc HPO | 91.1% | 90.1% | 89.0% | 89.9% | 90.8% | 90.8% | 2.02 | 2.59 | |
| Logistic Regression | Eldorado | 95.4% | 94.4% | 93.8% | 94.8% | 95.1% | 95.0% | 0.10 | 0.15 |
| Eldorado HPO | 96.7% | 95.5% | 95.1% | 96.0% | 96.5% | 96.5% | 0.17 | 41.46 | |
| UJIIndoorLoc | 87.9% | 88.0% | 86.8% | 87.2% | 87.5% | 87.5% | 0.33 | 0.62 | |
| UJIIndoorLoc HPO | 88.9% | 89.7% | 88.7% | 88.9% | 88.6% | 88.6% | 0.36 | 24.38 | |
| Random Forest | Eldorado | 97.4% | 98.4% | 97.0% | 96.6% | 97.2% | 97.2% | 0.23 | 0.21 |
| Eldorado HPO | 98.7% | 99.2% | 98.6% | 98.3% | 98.6% | 98.6% | 0.25 | 198.79 | |
| UJIIndoorLoc | 96.4% | 96.4% | 96.0% | 96.5% | 96.3% | 96.3% | 0.34 | 0.29 | |
| UJIIndoorLoc HPO | 97.5% | 96.9% | 96.8% | 97.3% | 97.4% | 97.4% | 0.36 | 262.20 | |
| SVC | Eldorado | 95.4% | 96.8% | 93.7% | 92.7% | 95.1% | 95.0% | 0.39 | 0.57 |
| Eldorado HPO | 95.4% | 94.4% | 93.8% | 94.8% | 95.1% | 95.0% | 0.38 | 9.91 | |
| UJIIndoorLoc | 80.4% | 80.3% | 76.3% | 76.5% | 79.8% | 79.7% | 0.91 | 1.04 | |
| UJIIndoorLoc HPO | 88.9% | 88.6% | 86.9% | 87.7% | 88.6% | 88.6% | 0.80 | 18.37 | |
| XGBoost | Eldorado | 99.3% | 99.5% | 99.5% | 99.5% | 99.3% | 99.3% | 0.05 | 1.29 |
| Eldorado HPO | 99.3% | 99.5% | 99.5% | 99.5% | 99.3% | 99.3% | 0.05 | 144.00 | |
| UJIIndoorLoc | 93.2% | 92.3% | 91.2% | 91.6% | 93.0% | 93.0% | 0.29 | 2.36 | |
| UJIIndoorLoc HPO | 91.8% | 91.7% | 90.4% | 90.9% | 91.6% | 91.5% | 0.29 | 220.41 |